Inspection Systems
Coated Glass Fiber Mat Online Defect Inspection System
For coated glass fiber mat lines, it scans both sides across the full width without contact, identifies foreign matter, holes, dirty yarn, stains, fuzz balls and other defects with machine vision and deep learning, raises real-time alarms and traces every defect by meter mark, replacing manual visual sampling.
Highlights
- 3 color industrial cameras on the front + 3 on the back, both sides inspected simultaneously
- 0.2 mm/pixel, defects ≥2 mm detectable, 3 stitched cameras cover 1.3 m width
- Deep learning defect classification and location; Class A miss rate ≤1%, false alarm rate ≤3%
- Encoder hardware triggering with cameras and LED strobes in sync, for line speeds up to 30 m/min
- CPU-only inference with no GPU, ≤200 ms from detection to alarm
- Lighting verified on real samples with front light, backlight and combined setups
Overview
Coated glass fiber mat offers uniform thickness, high strength and chemical resistance, and is widely used in pipe corrosion protection, automotive interiors, building materials and electrical insulation. As the base reinforcement layer of composites, its surface defects directly affect the structural performance and reliability of downstream products. Manual visual sampling faces several problems:
- Wide material, many blind spots: at 1.3–3 m wide and running continuously, manual patrols leave large blind spots, attention drops and defects are missed.
- Costly escapes: once a defect reaches downstream processes, losses grow quickly, and in serious cases lead to complaints or recalls.
- Inconsistent criteria: recognition and handling depend on experience, so results vary.
- Hard to trace: without digital records, quality problems are hard to trace back and analyze.
The Coated Glass Fiber Mat Online Defect Inspection System replaces manual visual sampling with machine vision and deep learning. It scans both sides across the full width without contact, identifies defects in real time, raises alarms immediately and keeps a full trace.
Compared with manual visual sampling
| Item | Manual visual sampling | Online inspection |
|---|---|---|
| Coverage | Sampling, with blind spots | Continuous full width |
| Sides | Usually front only | Front and back simultaneously |
| Method | Visual / contact | Non-contact, keeps the production rhythm |
| Consistency | Varies by operator | Uniform algorithm criteria |
| Traceability | Difficult | Meter mark + cross position + image |
| Quality statistics | Manual records | Automatic statistics, multi-criteria queries, reports |
Key advantages
- Two-sided inspection: 3 cameras on the front and 3 on the back, with 2 LED strobe lights per side illuminating from front and rear, so back-side defects are not missed.
- Full width at high resolution: 0.2 mm/pixel, 489.6 mm field per camera and about 1467 mm with 3 cameras stitched, covering 1.3 m width with margin.
- AI recognition: deep learning classifies and locates defects including foreign matter, holes, dirty yarn, stains and fuzz balls; color imaging separates color-related defects.
- Hardware triggering with frame-rate headroom: encoder / line speed → trigger distributor → camera hardware trigger → LED strobe sync, avoiding software trigger jitter; ROI mode leaves about 20× frame-rate headroom.
- CPU-only inference: a multi-core, high-clock industrial PC handles real-time inference without a GPU, lowering hardware cost, power consumption and maintenance complexity.
- Line integration and continuous improvement: takes line speed, length, running and new roll signals, and links severe defects to audible/visual alarms; the model keeps learning as samples accumulate.
Architecture
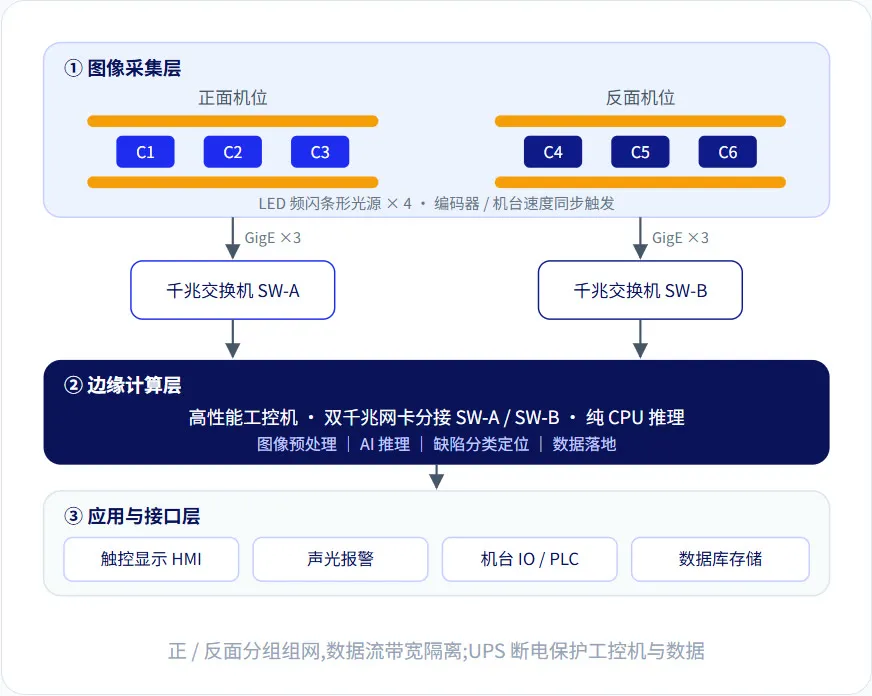
Image acquisition, edge computing and application layers are decoupled, so adding cameras, updating algorithms and extending functions do not affect each other. Front and back are networked separately with isolated data bandwidth.
- Image acquisition: 6 × 5 MP color global-shutter cameras with 12 mm low-distortion lenses and industrial housings (optical window, dust purge); 2 white LED strobe lights per side, hardware-triggered in sync with the cameras.
- Edge computing: an Intel i9-class industrial PC takes the front and back data streams on two separate gigabit NICs for pre-processing, AI inference, defect classification and location, and storage; an online UPS triggers a normal shutdown on power loss, protecting disks and data.
- Application and interfaces: live view, defect management, reports, model training and database storage in one platform; operated on a 21.5-inch industrial touchscreen, with an IO module connecting to line signals and audible/visual alarms.
Workflow
- Synchronized capture: encoder / line speed triggers cameras and strobe lights together
- Pre-processing: contrast enhancement, ROI cropping and stitching of the 3 cameras across the width
- AI inference: CPU-only inference at the edge extracts suspicious regions
- Classification and location: outputs defect class, grade, size and coordinates
- Response and traceability: audible/visual alarms, with defect data and images stored
Typical defects
The reference defect classes agreed in the technical appendix are listed below. Alarm, prompt and storage actions can be switched per class in the software.
| No. | Defect | Description | Default response |
|---|---|---|---|
| D01 | Foreign matter | Leftover tape, stickers | Audible/visual alarm + stored |
| D02 | Hole | Abnormal structural gap | Audible/visual alarm + stored |
| D03 | Dirty yarn | Abnormally colored yarn in streaks | Audible/visual alarm + stored |
| D04 | Stain | Oil / water / dye spots | Audible/visual alarm + stored |
| D05 | Fuzz ball | Fiber agglomerate | Audible/visual alarm + stored |
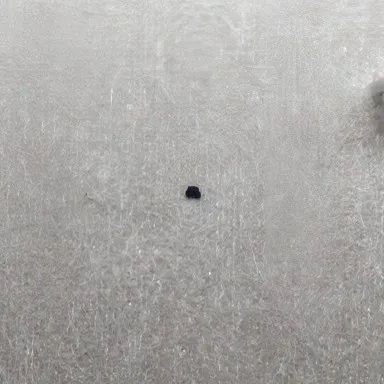
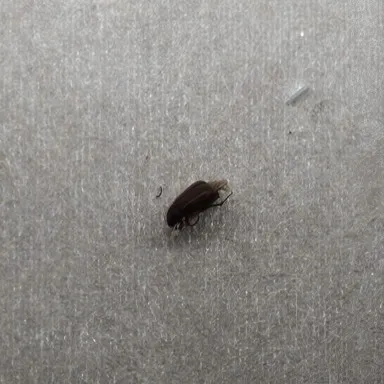
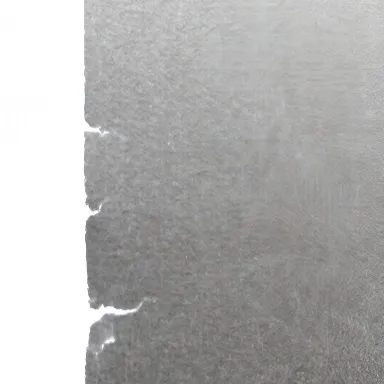
Sample tests also showed torn edges, creases, insects and debris, which can likewise be included in training and recognition. Final defect classes are subject to on-site sample collection, labeling and mutual confirmation.
Sample test
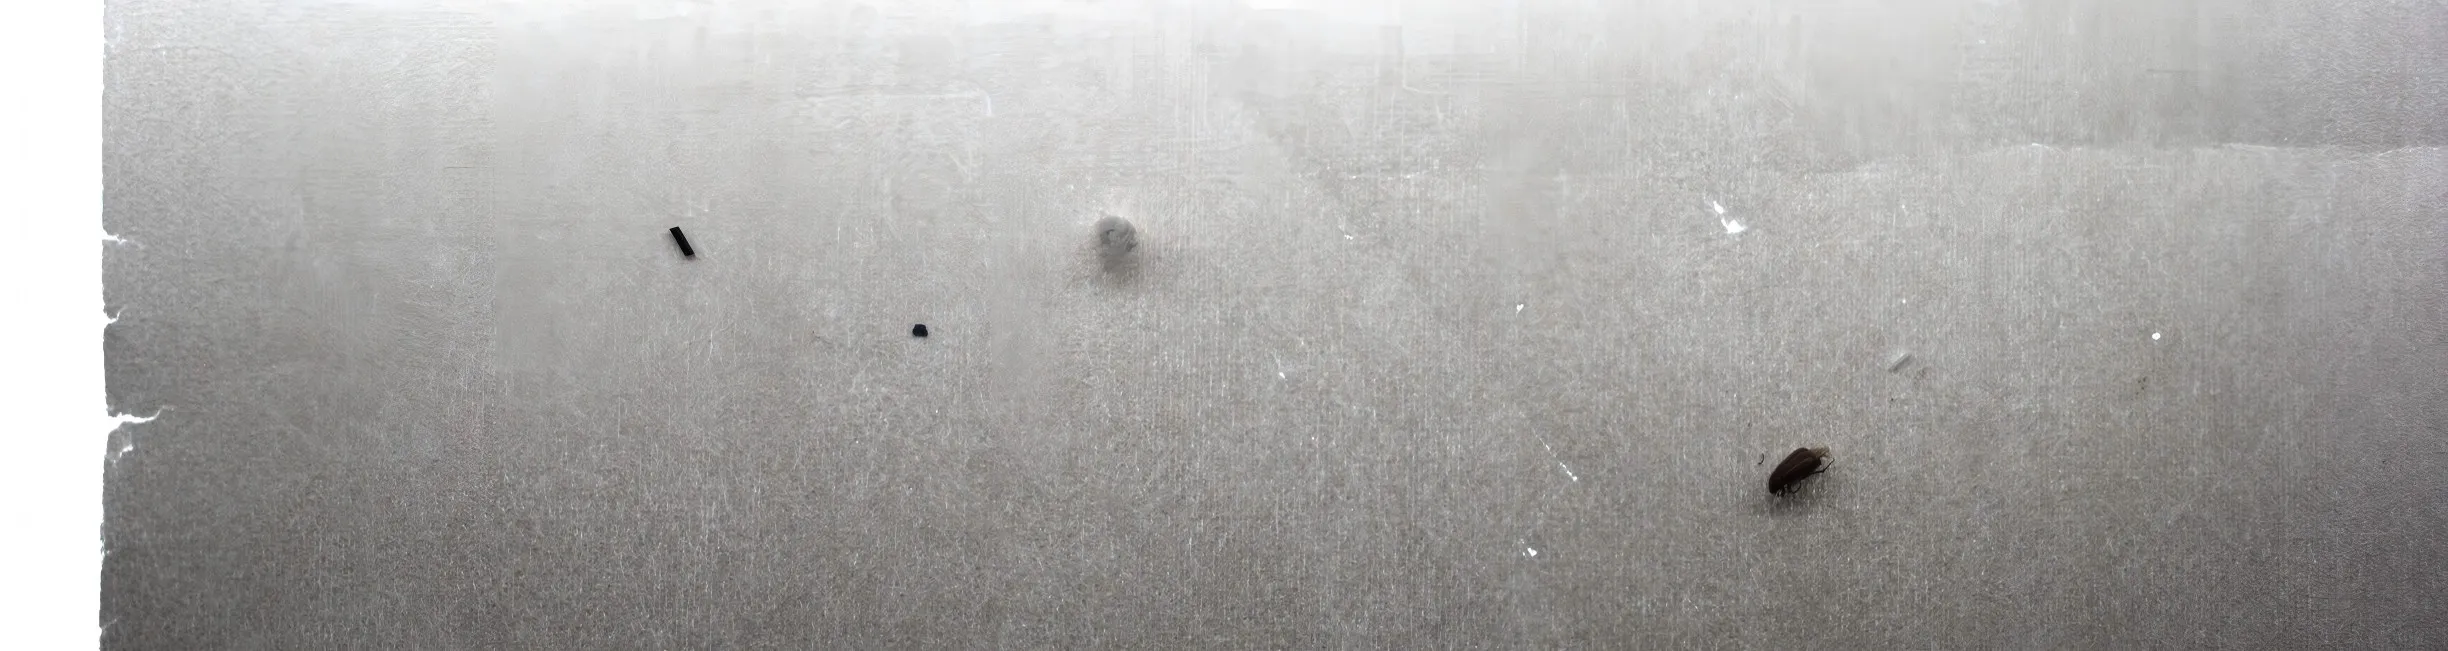
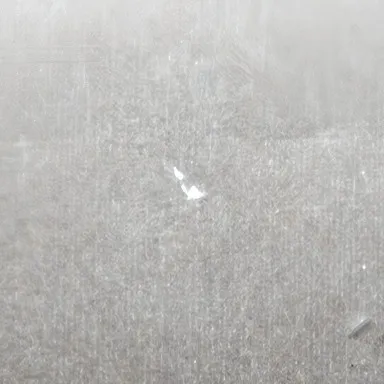
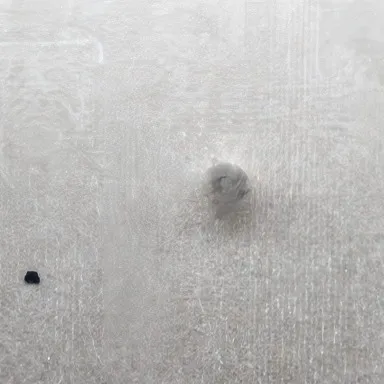
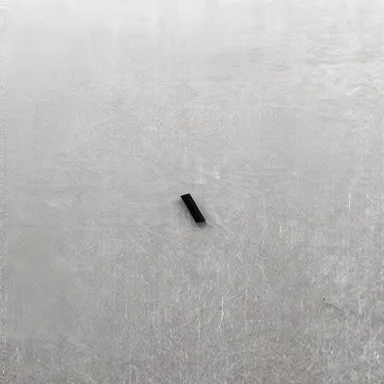
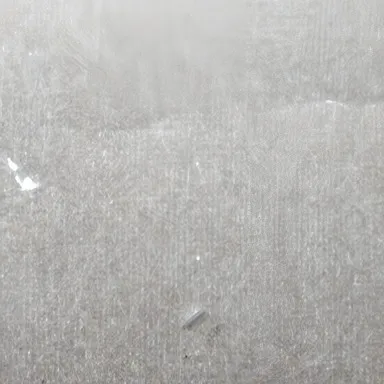
On June 27, 2026, we ran lighting and image capture tests in our lab on a D6OC/1215 coated mat sample to verify the imaging clarity and defect contrast of the camera, lens and lighting combination. The cover shows the combined capture of this sample (effective area 489.6 × 130.2 mm per image, 2448 × 651 px). The gallery shows original crops (384 × 384 px, about 76.8 × 76.8 mm) of a hole, fuzz ball, foreign matter (strip), foreign matter (particle), insect, crease, torn edge and debris, in that order.
- Front light (reflection): light on the front side clearly shows surface defects such as foreign matter, creases, debris and torn edges.
- Backlight (transmission): light from behind makes see-through defects such as holes appear bright, with clear edges that are easy to locate.
- Combined lighting: front light and backlight together capture both see-through and reflective defects at once.
Conclusion: the imaging setup is feasible, the lighting is effective and defects are detectable. High-contrast defects image clearly, and low-contrast defects become identifiable after enhancement. This was a static lab capture; final performance is subject to acceptance under dynamic on-site conditions.
Software
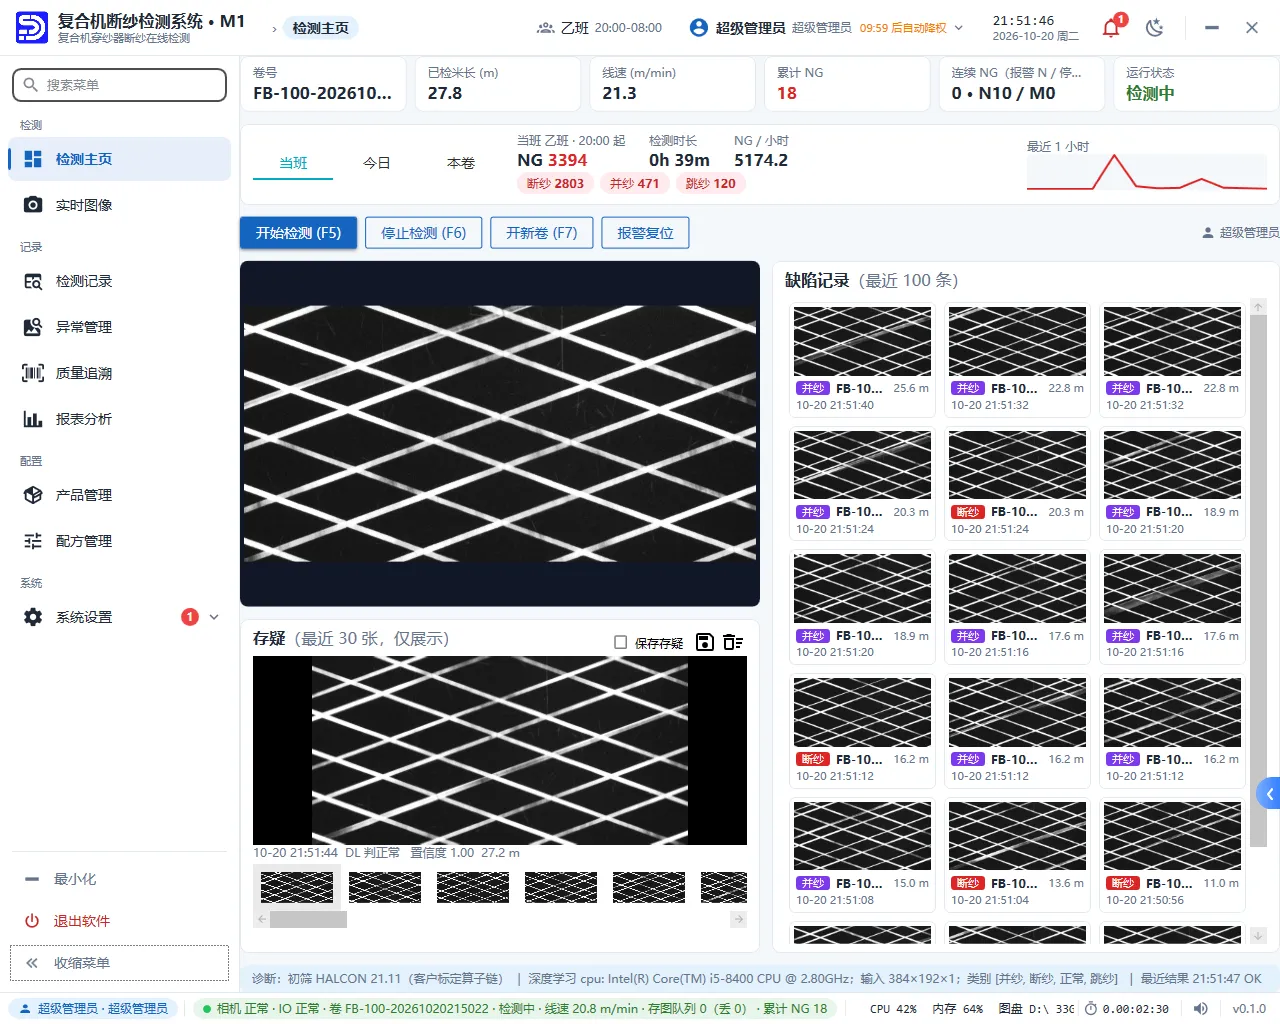
- Live inspection: front and back views shown in real time with defects overlaid; meter mark and status always visible.
- Defect management: meter mark + cross position, type, grade and original image recorded for every defect, with multi-criteria queries.
- Reports: defect type distribution and trends to support process improvement and quality analysis.
- Model training: continued training as on-site samples accumulate, improving recognition over time.
- Linked response: severe defects trigger audible/visual alarms; alarm, prompt and storage actions switchable per class.
- Data storage: defect data and images stored persistently, with UPS keeping data intact on power loss.
Delivery and service
Full delivery from sample testing and site survey to factory acceptance test (FAT) and site acceptance test (SAT), with continued sample collection and model iteration after go-live. Send us samples and we arrange lab lighting tests with a test report; FAT and SAT are carried out item by item against the technical appendix; installation, commissioning, operator training and complete technical documentation are included; system software and algorithms are upgraded free of charge for one year.
Notes
The above is the standard configuration; on-site width, line speed and machine interfaces are confirmed by site survey. Miss and false alarm rates are achieved after training on ≥200 defect samples per type and are subject to site acceptance; if samples are insufficient, SAT can be split into functional acceptance and performance acceptance.
Gallery
Related products
 Product video1:34
Inspection Systems
Yarn Break Inspection System for Laminating Machines
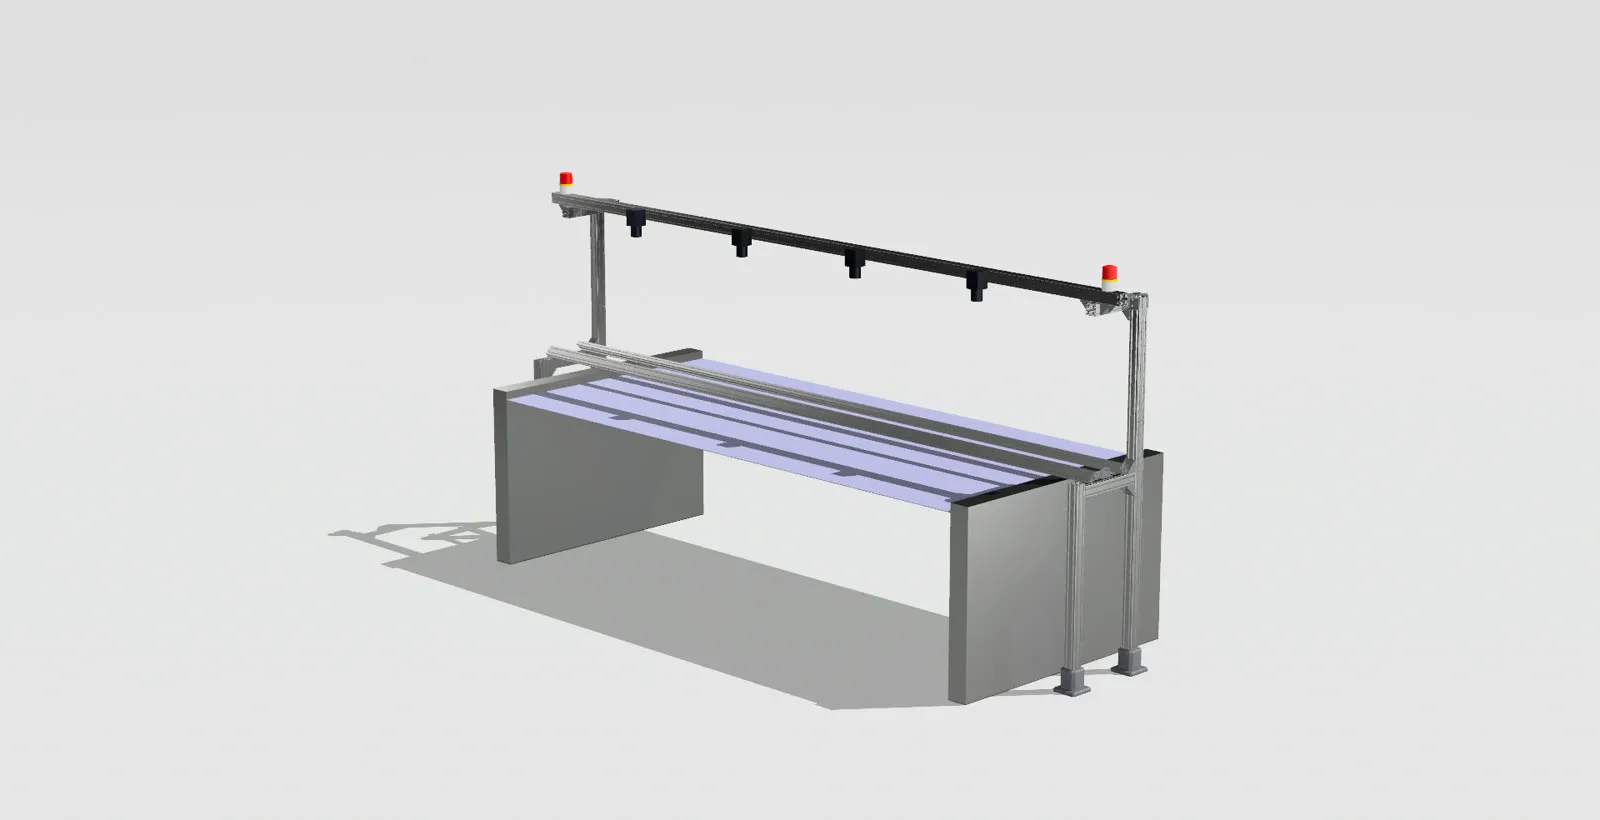
Installed at the yarn guide station of a laminating machine, it uses an industrial camera and vision algorithms to detect broken, merged and skipped yarns in fiberglass / polyester scrim inline, triggers alarms and machine stops, and keeps full roll-level traceability.
- Line speed
- 0–20 m/min
- Alarm response
- ≤100 ms
Details
Inspection Systems
Stenter Fabric Defect Inspection System
Installed at the stenter or other finishing stations, it uses industrial cameras, LED lighting and deep learning to detect holes, pulled threads, color spots and other defects on mosquito net greige and mesh fabric inline, with graded alarms, automatic marking and roll-level traceability.
Details
Inspection Systems
UD Fabric Online Defect Inspection System
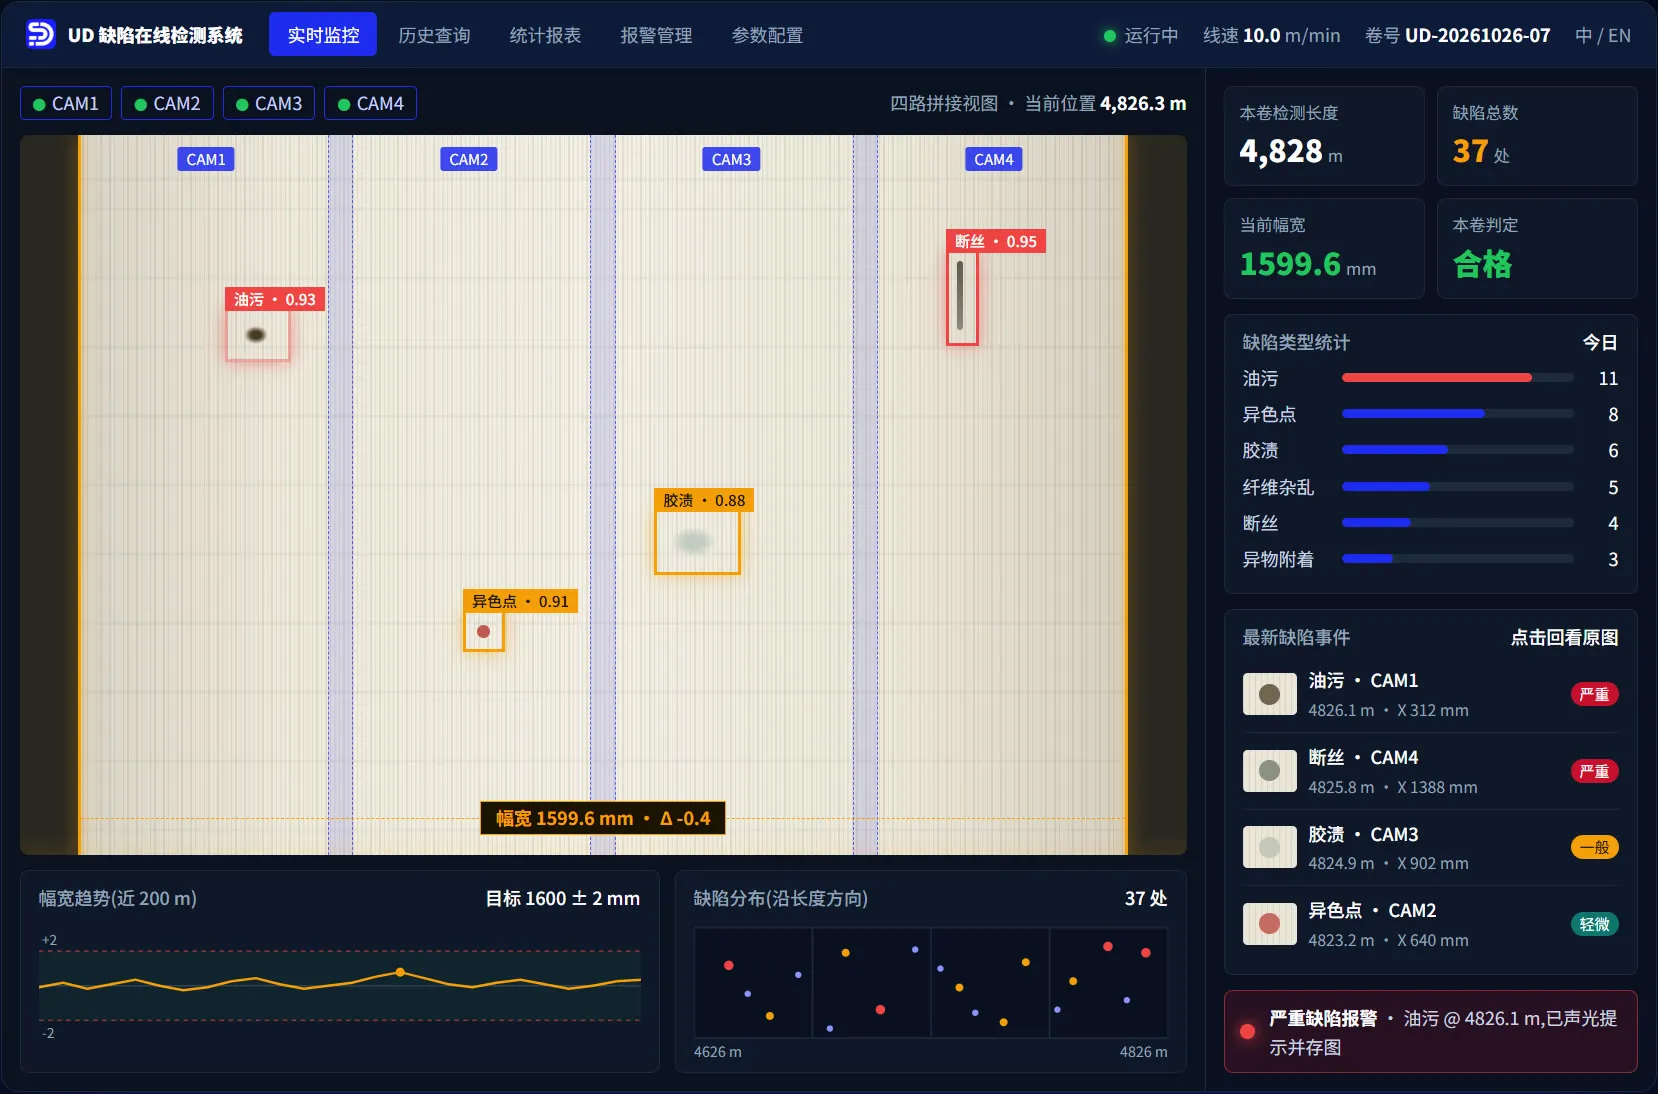
For continuous unidirectional (UD) fabric lines, 4 stitched cameras image the full width while machine vision and deep learning inspect surface defects and measure width at the same time, with real-time alarms and meter-based traceability, replacing manual sampling.
- Fabric width
- About 1.6 m
- Pixel size
- About 0.2 mm/pixel
Details
Have an inspection challenge?
Tell us about your product and requirements. Our engineers will assess feasibility.